
The first work I did for Behind the Name was modernizing the site user experience. The CEO wanted the site to have an archival, authoritative image, so I proposed a papyrus design. Additionally, other aspects of the user experience were improved, such as text size and margins. As a result, the average session time and pages-per-sessions which had been steadily declining for years were immediately leveled out upon launch, and then began to grow.
This growth led to increased revenue and made the site profitable for the first time in the mid 2010s.
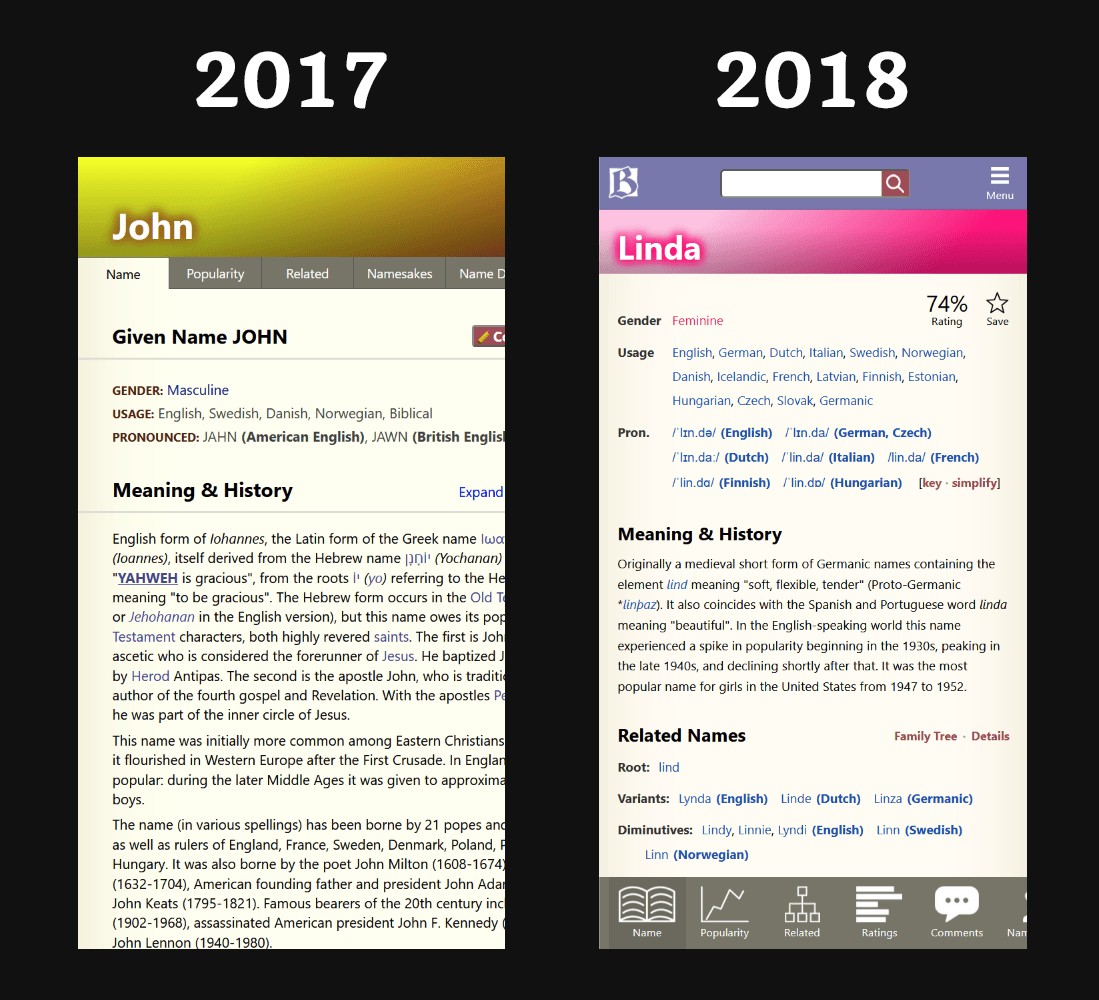
The initial redesign of Behind the Name included a mobile design which was not implemented initially. Years later, the lack of mobile support led to rapidly declining search traffic. This redesign, though somewhat dated at launch, nonetheless turned the decline into growth, and the site saw a 50% increase in traffic over three years.
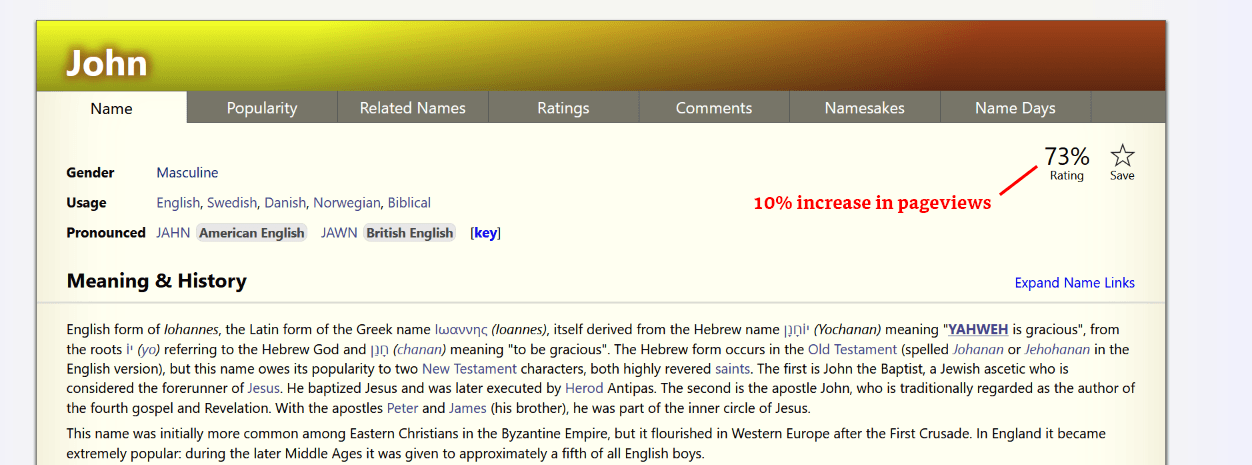
A simple feature increased pageviews by 10%
BTN relies solely on ad revenue, and therefore page views.
Previously if users wanted to see the overall rating of a name, they had to go to the Ratings page, and even then the score was not clearly displayed. This meant that users wanting to compare the ratings of multiple names had to click more for less information. The rating indicator allowed users to jump from name to name comparing ratings, which turned out to be a compelling activity, as that simple change led to a permanent 10% sitewide increase in page views.

I used XenBuild to help the company leadership understand what Behind the Name is
As part of a comprehensive strategic planning project, I used my own tool, XenBuild, to map out the product and provide a top-down view of the structure of the sprawling site, along with metrics visualizing where traffic was going, and where it was staying.

I created a high-resolution picture of user behavior with low-resolution data
Using my own tool, the Use Case Finder, I identified behavioral clusters in the Google Analytics data. In the absence of Big Query, which enables session data tracking, I used good old fashioned statistical magic to track clusters of similar users. The closer two dots (which are pages or scripts) are to each other, the more likely it is that the same people, or similar people, are accessing them. This work guided subsequent user research in late 2024.