An interface dialed in from intensive use and testing
I have been using XenBuild as a methodology since 2020, and as a product since 2022. I have used it in real-life projects, and conducted trials with users at various government and academic institutions. This has enabled me to design the most effective visual representation of a software product.
It can communicate complex concepts at a glance
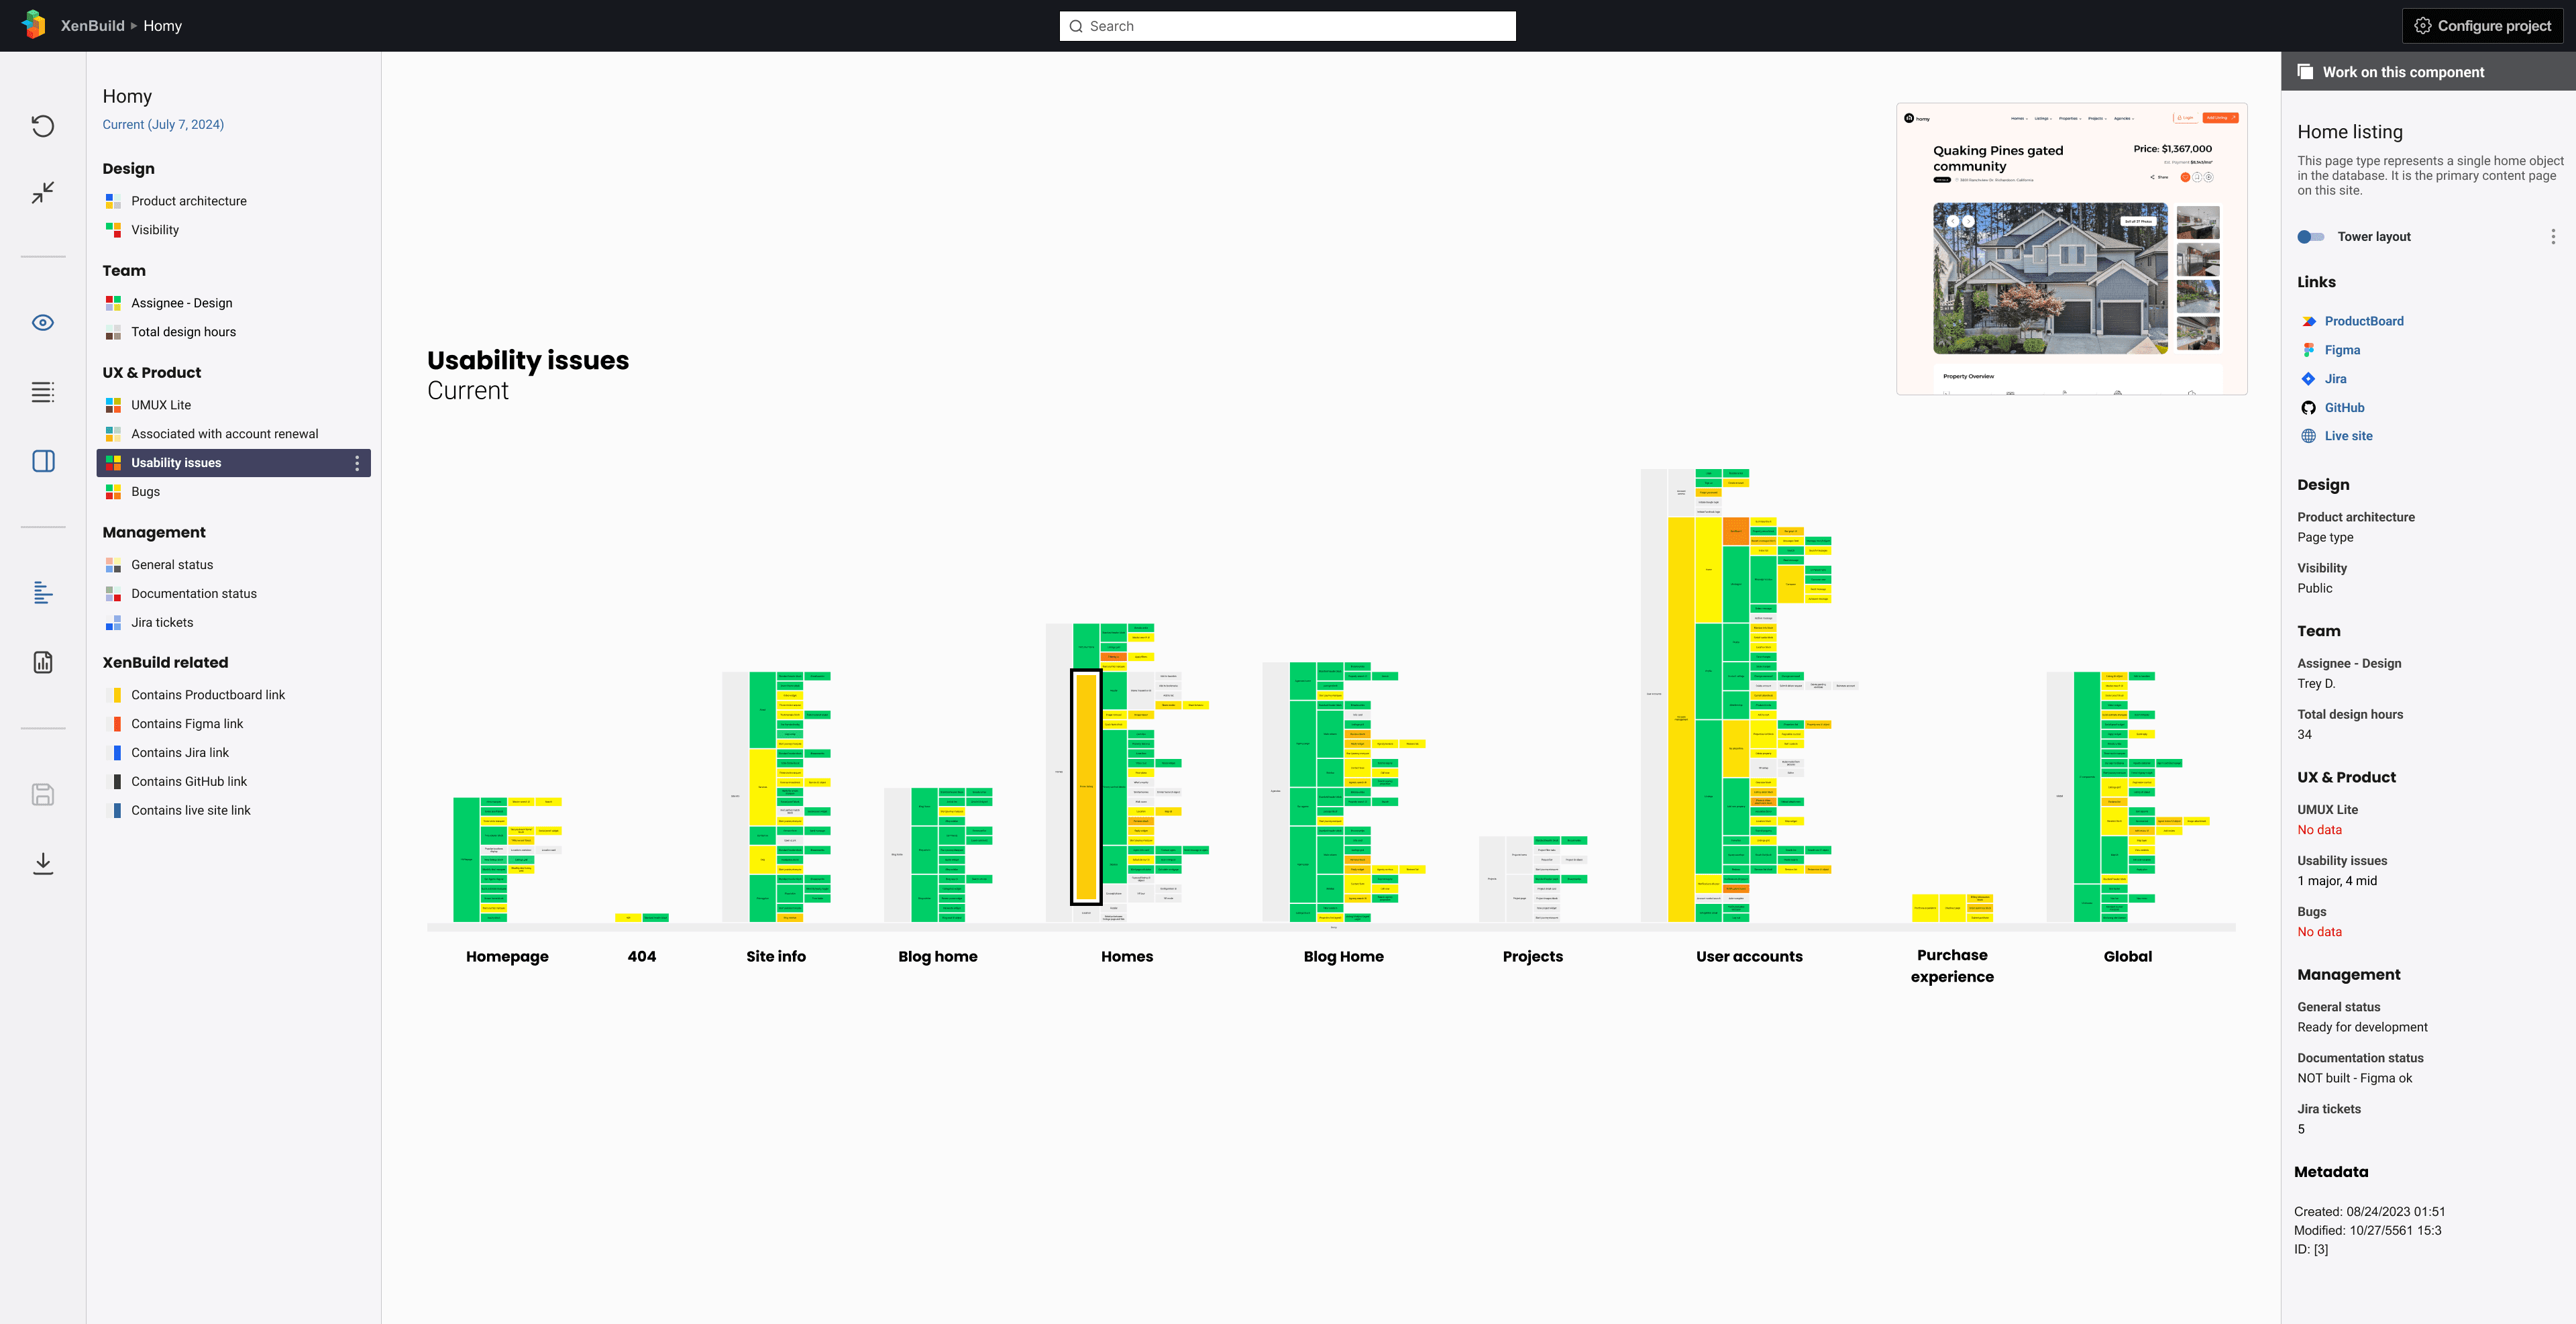
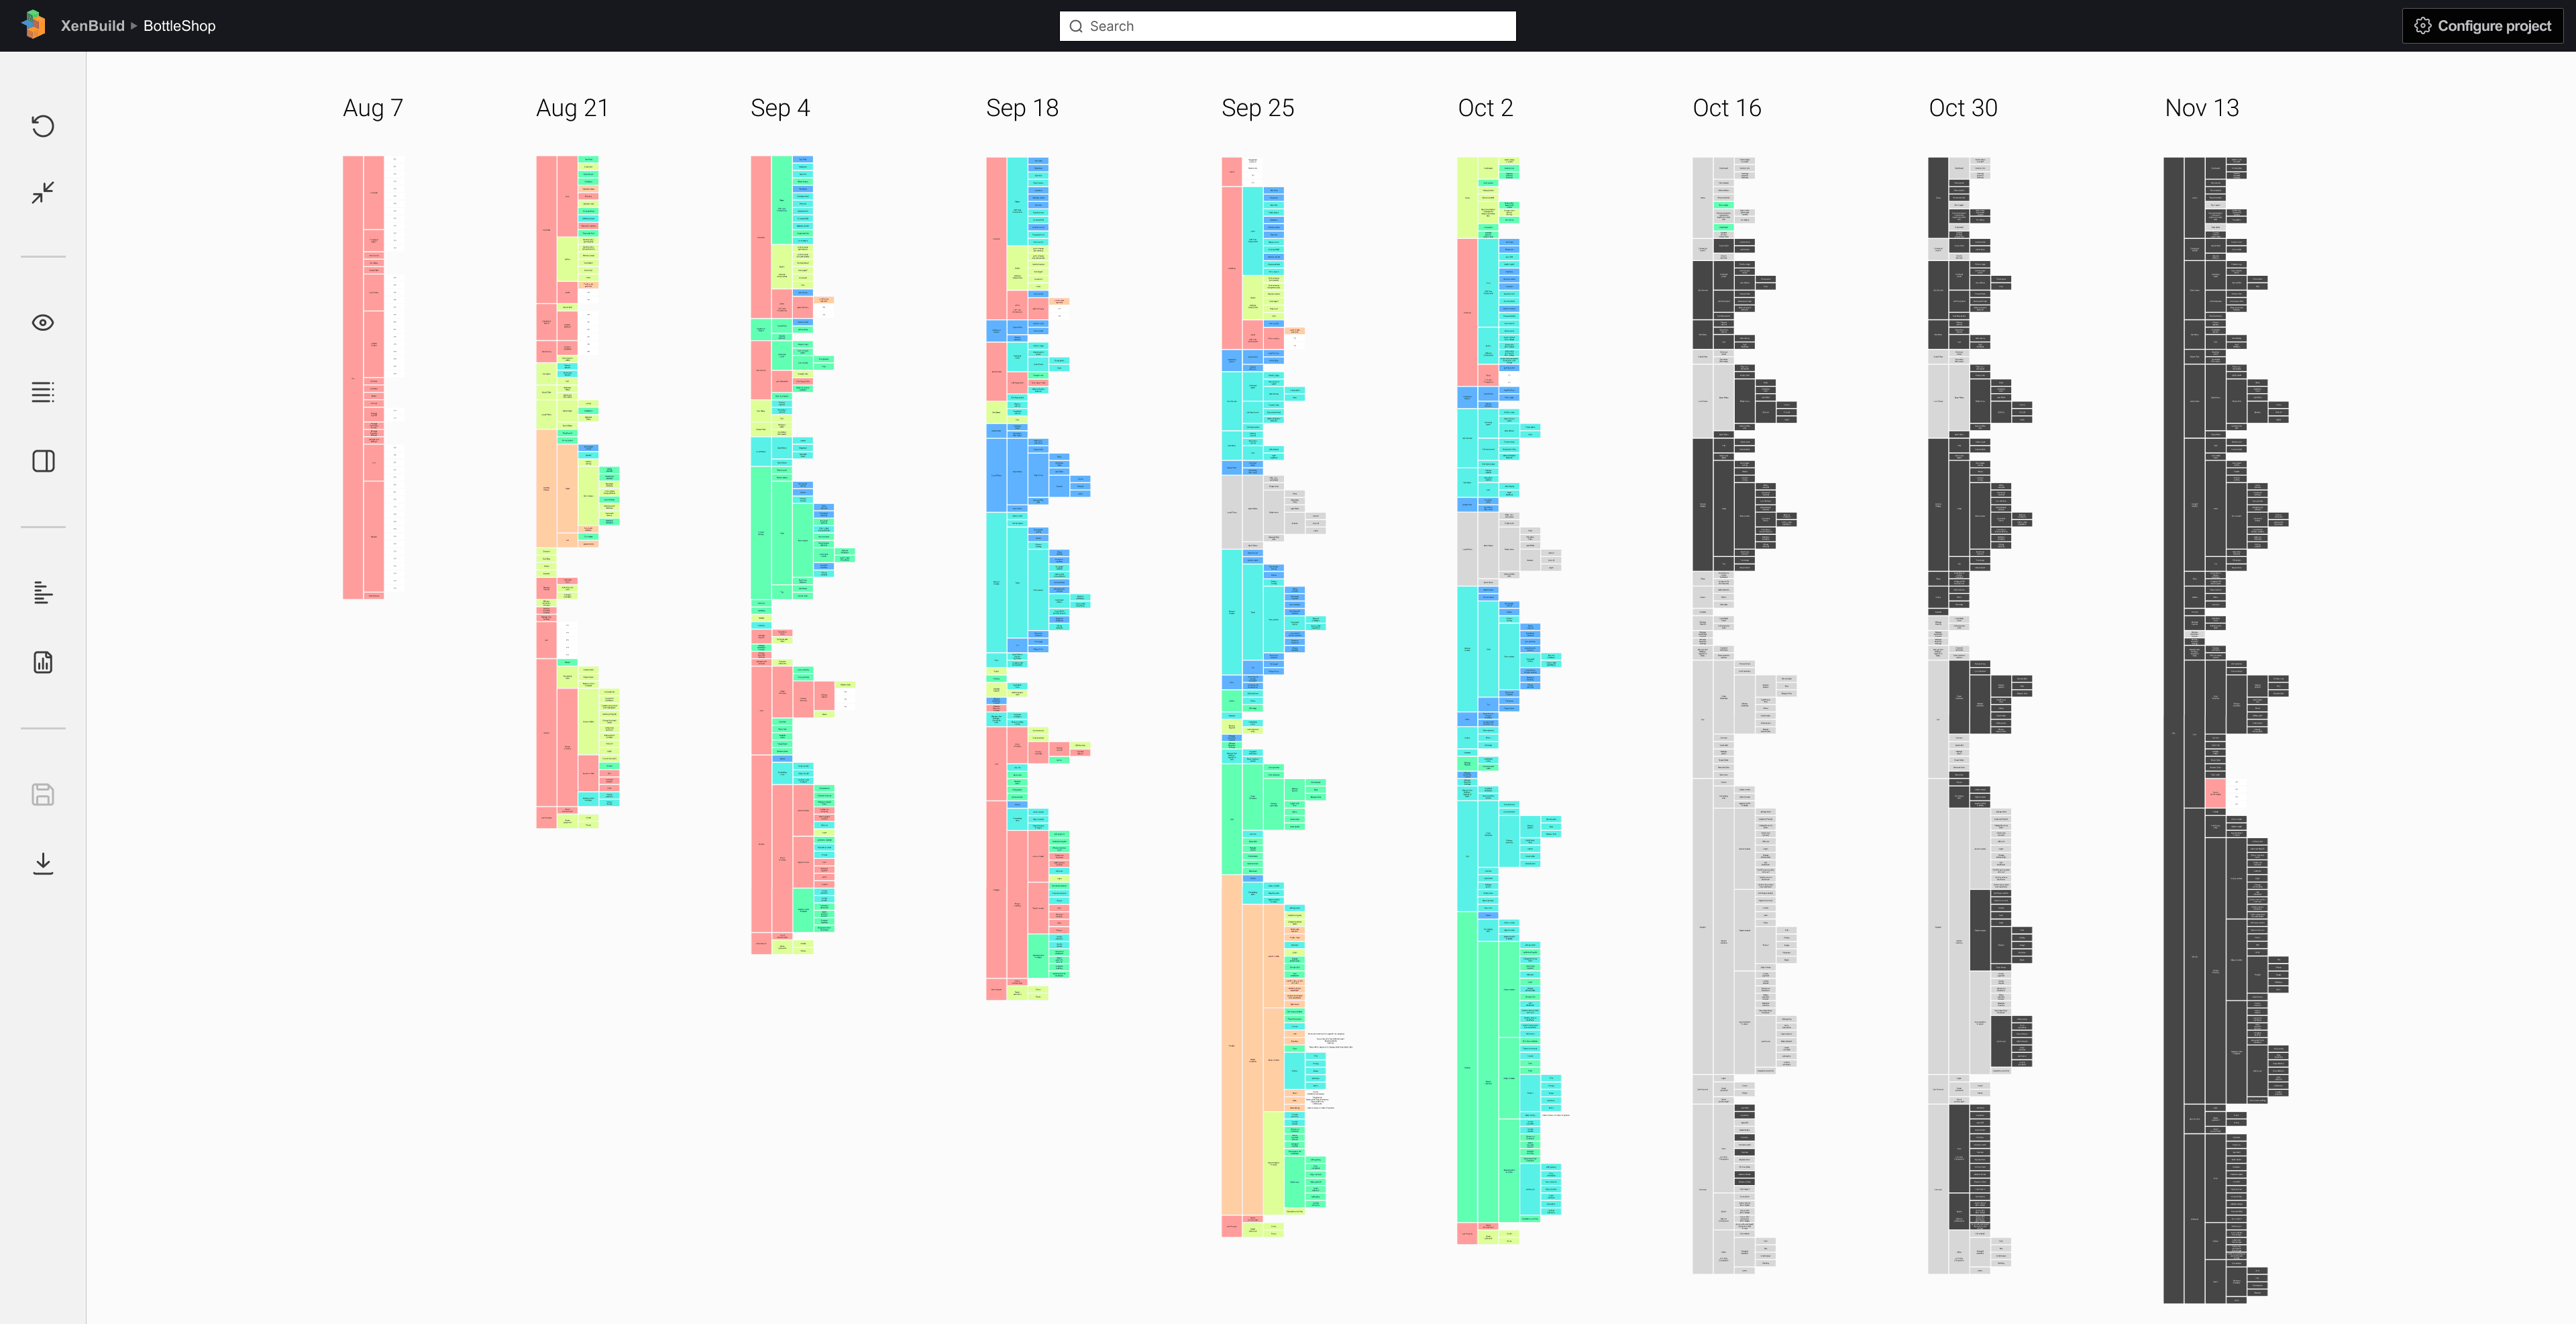
One of the most powerful use cases for XenBuild is tracking design and development progress. Normally, this would have to be done with things like Gantt charts, Kanban boards, or line graphs, however all of these oversimplify the complexity of a software project. The small multiples model of XenBuild allows the user to see where progress is occurring and where it isn't, across any number of variables.
Its flexibility lets it adapt to any project
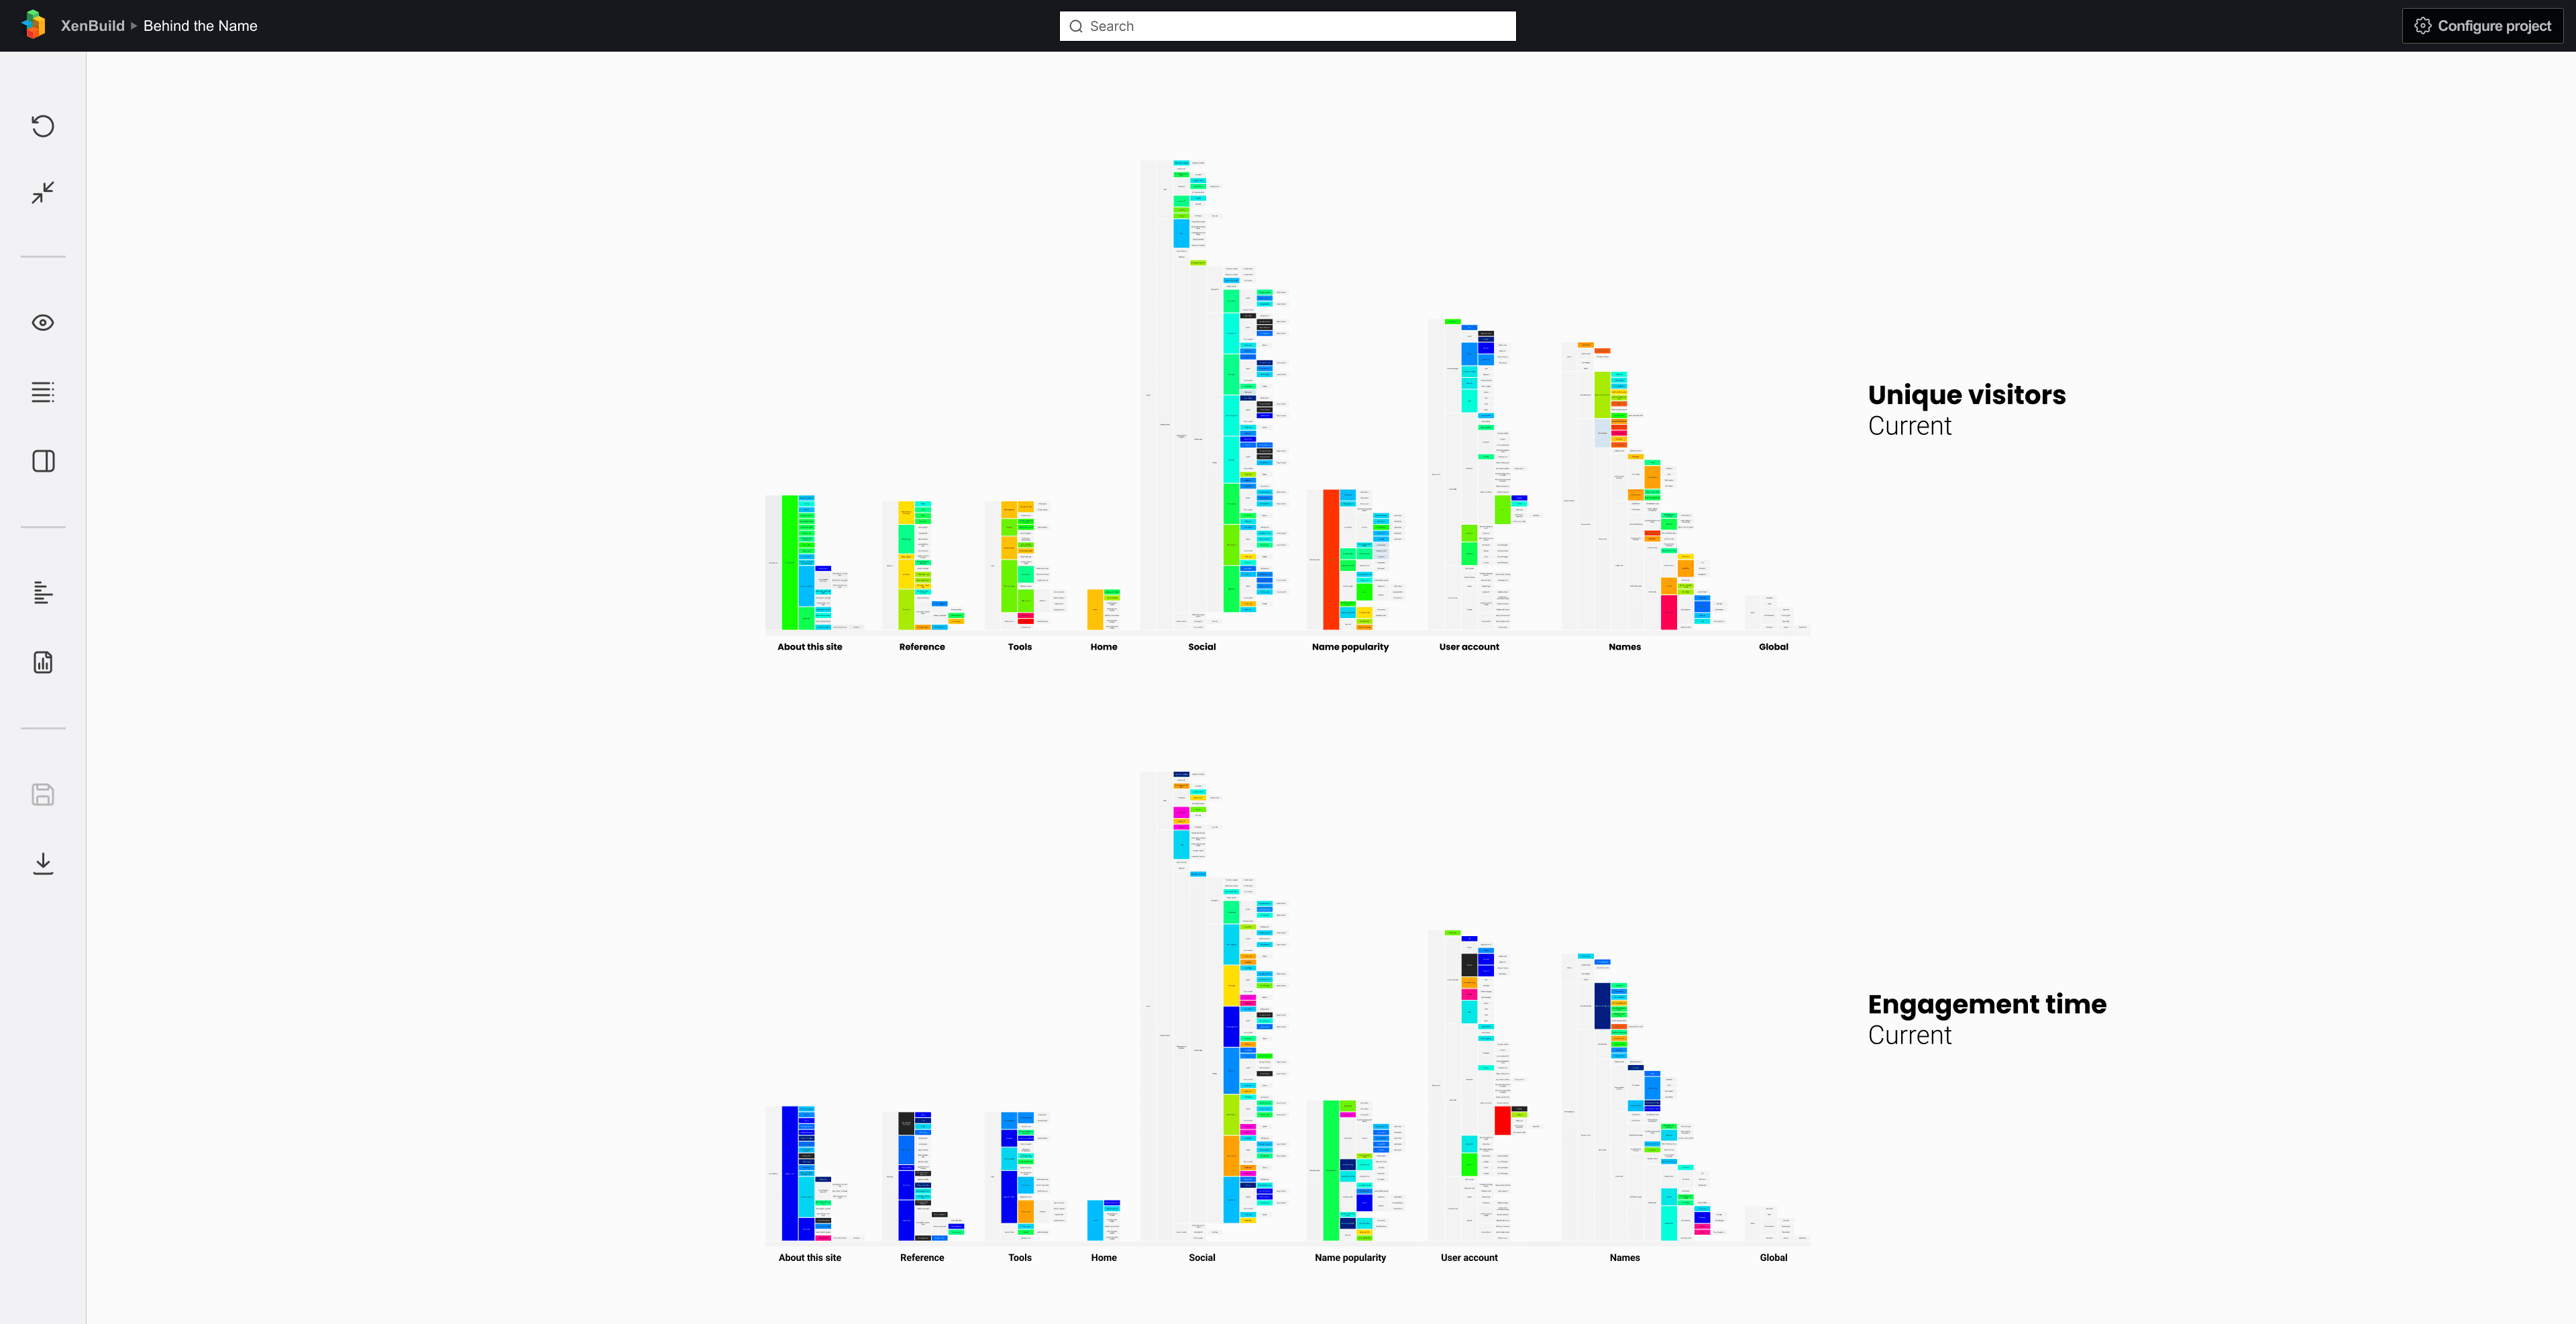
Whether it is being used to track development on a new product or visualize a site's traffic, XenBuild's format is adaptable due to its universal nature. My work in information architecture and data visualization over the past two decades have culminated in XenBuild.


